No official affiliation with Hedgeye. Just a power user that wanted to see what Kieth was seeing on his screen Sign up here to see the tickers Kieth talked about on the Macro Show today.
Monday, March 16, 2026
|
Welcome back Reader!
|
Pro Tip: If you need bigger charts use desktop instead of mobile.
New Similar Set Handbook
Confused about what's going on in the newsletter?
| Use Handbook |
More questions?
Drop them on X: @Similar_set
If this market feels like a major bear market, it's because you didn't adjust your positioning as the market shifted from a raging bubble to the recent breakdown into bearish TRENDs. Now we could still see a real bear market from here—but the data doesn't point to that yet. But that doesn't mean it can't happen; we're still in a lot of bearish TRENDs overall.
VIX
The Similar Set Signal has been leading the way, telling you to prepare for this volatility storm ever since it flipped bullish on February 25.
Thursday night: "Expect a volatility storm tomorrow."
Friday: We closed at the low end of the RANGE across all major U.S. indices.
|


Were you prepared for Friday morning? Did you cover some positions into the close at the low end of the RANGE? That's exactly what the math and process instructed. It's up to you to see the math clearly and have the discipline to execute.
Today: Price gapped below TRADE, flipping it to bearish TRADE. That's the kind of move you should notice in real time. Currently, price is under TREND too, but we need a close + separation to confirm a full break.
Remember last time it broke TREND in November? The signal told you the exact date the volatility storm would end.
QQQ
Time to get short: Thursday.
Time to sell some: At the bottom end of the RANGE.
Bag7
The Mag 7 broke down on February 4—well before this "bear market" narrative.
It gave very clear instructions last Wednesday: Get short (bearish TRADE + TREND at RANGE — Rally arrow).
Then sell on Friday (low end of the RANGE round trip → ~4% in 3 days).
MOVE
Were you ready for this storm two weeks ago?
Bond volatility blew out. Now it's at the top end of the RANGE as VIX flips to bearish TRADE. We could see some relief, but note the signal is strengthening to the upside—RANGE crossing above TREND.
Can you hold both views? It's extended, so expect mean reversion inside an overall bullish fractal structure.
HYG
No bottom in credit yet either. VIX led the way down by a few days so the start of this week is very important: bear market rallies are violent, and depending on how far they go, they could mark a bottom.
The simplest approach? Get the math on your screen and follow the instructions daily. No predictions—just execution.
Sector Signals
We’re in the middle of a volatility storm.
Did you reduce U.S. equities exposure, cut/reduce weakening signals, and concentrate into Energy and Utilities?
Did you put on shorts when VIX was at the top end of the RANGE, then reload when VIX pull backed down to TREND in weak-signal sectors like XLY—especially in tickers like TSLA?
It's extremely hard to see all of this in real time if you're just getting snippets from alerts or morning shows instead of seeing the full math. Not so much if you can't see it for yourself.
XLY
Last Wednesday wasn't the start of bearish signals. The market was giving instructions on February 19—when and where to hedge.
You'll never improve if you don't go back and review what you did vs. what the math said to do.
TSLA
Instructions: Flat → Short Entry → Short RANGE
XLE
Energy isn't in a bear market.
If you did your job on March 10, you have some to sell here at the top end of the RANGE.
XLU
What did you do March 10th? The broad market went straight down. The Fractal Signals in XLE and XLU both went to the top end of the RANGE.
Macro Markets
Oil up, bonds down, FX down, gold stable—how are you positioned in global macro?
SHY
Broke bearish TREND on March 2. Six trading days later, TLT broke too.
There's that date again: March 10. It was a significant day to execute—but you'll never know which days are significant until after the fact. That's why you need the discipline to act day in and day out.
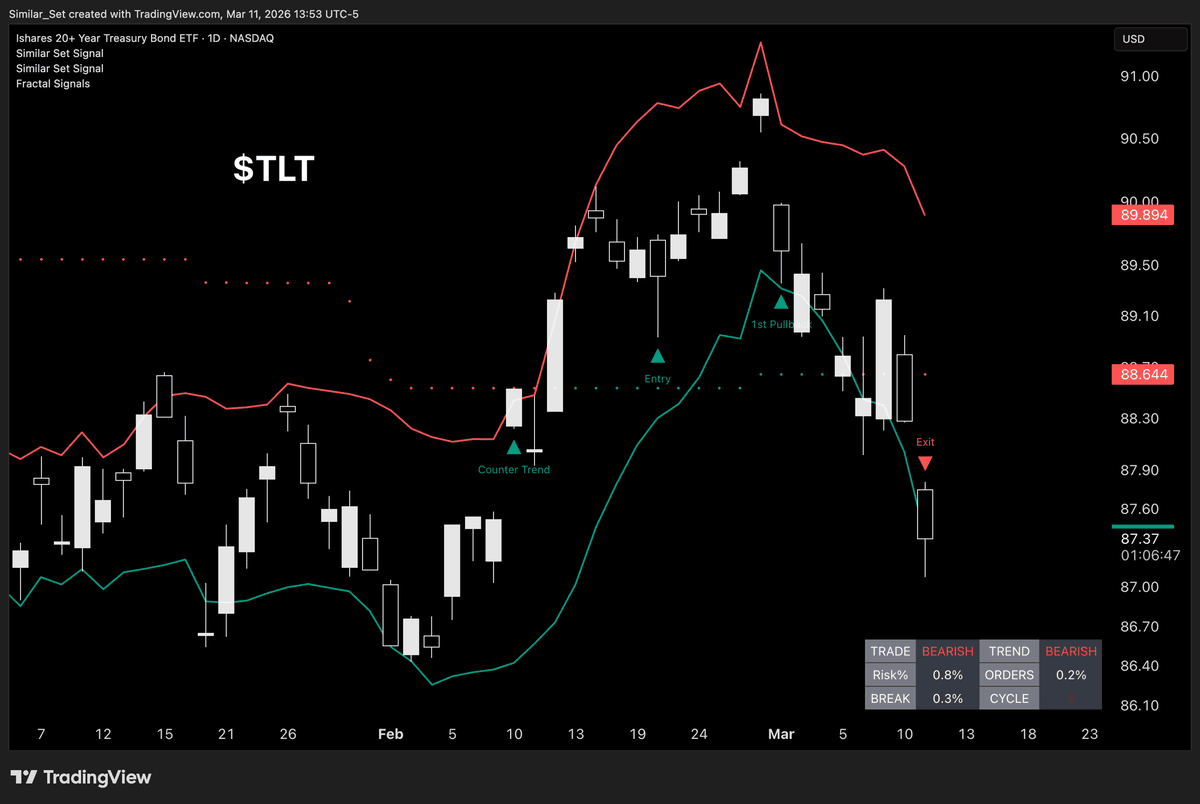
TLT
Did you notice the math change, or are you bag-holding the yield curve?
|
GVAL
Dollar up means global equities get hit.
Did you see the math change on March 3? It told you where we are now was expected—not a surprise.
DXY
Study this chart. It's textbook and the most important one to get right in global macro.
If you followed the instruction to get long on March 2, the signal just told you to sell some more on Friday.
HECA (Hedgeye Asset Management)
Got the expected bounce off TREND, but now the low end of the RANGE is making lower highs. When you enter from the right places, you get the benefit of stress-free waiting and watching. If it breaks TREND, exit. If it hits the top end, sell some.
USO
Bullish TRADE/TREND with RANGE well above TREND. Math caught up with the parabolic move—be ready to buy the dip 11% lower at $104.
GLD
I wasn't buying on Friday and already knew my next two moves before they happened.
Getting close to TREND here, but you should already be in gold and it hates rising yields, the 30-year is clearly in bullish TREND, and MOVE isn't signaling a change yet. Be ready to cut GLD if it breaks TREND—just like last week in TLT.
Know your next move before it happens.
SLV
Nothing on this chart says be exposed to silver. The safer play has been gold because that's what the math says.
You can adjust position size on gold to get similar net returns with lower percent swings. I've been gold-only in precious metals since the blow-off top. Zero stress. If you're still holding silver, can you say the same?
Every newsletter is posted here—you can go back and review any week anytime: https://similarset.kit.com/posts
Thursday, February 5, 2026
Bitcoin
Wednesday, March 11, 2026
Up day after up day, grinding higher. Why? Similar Set TRADE.
MSTR
Most people have tried to call a bottom since October. I haven't once said get long MSTR. That might change if it can close bullish TREND. It clearly flipped bullish TRADE late last week. Near-term direction is up, and the top end of the RANGE is above TREND and rising.
That's a significant signal change—one you can't fully appreciate from daily posted numbers alone. Having it visually makes all the difference.
Does your conviction come from someone else’s decisions… or do you have a clearly defined edge on your screen that you can execute on your own, without anyone else’s help?
If you want daily access to this math to act on them in real time—subscribe to Similar Set Signal today and start seeing what the process actually tells you to do.
90-DAY MONEY BACK GUARANTEE
3-month interest-free payment plan.
| TRY TODAY |
What are customers saying about the Similar Set Signal?
Your Signal is already paying off nicely
This is exactly what all Hedgeye subs are missing
What a game changer
Accelerated my understanding of the process like you can’t believe
This is the tool I needed!
For the first time since becoming a Hedgeye sub
My win percentage has gone roof"
If you have any questions, reply to this email and I'll get back to you!
Similar Set Signal
No official affiliation with Hedgeye. Just a power user that wanted to see what Kieth was seeing on his screen Sign up here to see the tickers Kieth talked about on the Macro Show today.
Welcome back Reader! How to Read Chart Left Side - Similar Set TREND Right Side - Similar Set TRADE Pro Tip: If you need bigger charts use desktop instead of mobile. New Similar Set Handbook Confused about what's going on in the newsletter? Use Handbook More questions? Drop them on X: @Similar_set "The Old Wall model was built on certainty, reassurance, and narratives, while AI and The Machine are replacing that with signal, speed, and accuracy." — Keith McCullough Yesterday marked a clear...
Welcome back Reader! How to Read Chart Left Side - Similar Set TREND Right Side - Similar Set TRADE Pro Tip: If you need bigger charts use desktop instead of mobile. New Similar Set Handbook Confused about what's going on in the newsletter? Use Handbook More questions? Drop them on X: @Similar_set "The #Quad4 probability is rising because the signals are changing across assets: Bitcoin, crypto, oil, volatility, megacap tech, the US Dollar, and bond yields are all showing more defensive...
Welcome back Reader! How to Read Chart Left Side - Similar Set TREND Right Side - Similar Set TRADE Pro Tip: If you need bigger charts use desktop instead of mobile. New Similar Set Handbook Confused about what's going on in the newsletter? Use Handbook More questions? Drop them on X: @Similar_set "Crash calls require signal, not narrative. The key is identifying emergent properties across similar sets, fractal dimensions, and multiple durations." — Keith McCullough If you are freaking out...